Gap and go, bull flags, ABCD
The classic momentum patterns on real-looking charts: where the entry is, where the stop goes, and what volume must confirm.
Three patterns, one idea
Every pattern on this page is the same story told at different moments: a stock surges on real buying, rests briefly while weak hands sell, then continues when buyers prove they are still in control. The entry is never during the surge and never during the rest. It is at the exact moment the rest ends.
The gap and go
A stock gaps up on overnight news and keeps going. The trigger most traders use is the break of the premarket high in the first minutes after the open, with volume expanding on the breakout candle. If the open drives down instead, there is no trade. The plan dies with the trigger, not with a feeling.
The bull flag
After a sharp vertical move, the pole, price drifts sideways or slightly down on shrinking volume. That drift is the flag. The entry is the break of the flag's high, the stop goes just under the flag's low, and volume must come back in on the breakout candle. A flag that retraces more than half the pole, or drifts on rising volume, is not a flag. It is distribution.
Notice where VWAP sits. Momentum traders treat the volume-weighted average price as the session's line in the sand. Above it, buyers who bought the average are in profit and dips get bought. A flag that holds above VWAP is the strong version of the pattern. A stock that loses VWAP has lost the session's buyers, and longs step aside.
The ABCD pattern
The beginner-friendly version of the same continuation logic, named for its four points. A is where the move starts, B is the first peak, C is the higher low that forms when the pullback holds above A, and D is the entry as price breaks back over B. The height from A to B projects the target above D.
When the party ends
- Extension. A stock that is up several hundred percent in days has less and less fuel. Late continuation patterns fail more often.
- First red day. After a multi-day run, the first day that closes firmly red often marks the top for a while. Momentum longs stop looking for flags on that day.
- Low volume breakouts. A breakout candle without a volume push is a trap more often than a trade.
A real one: GameStop, January 2021
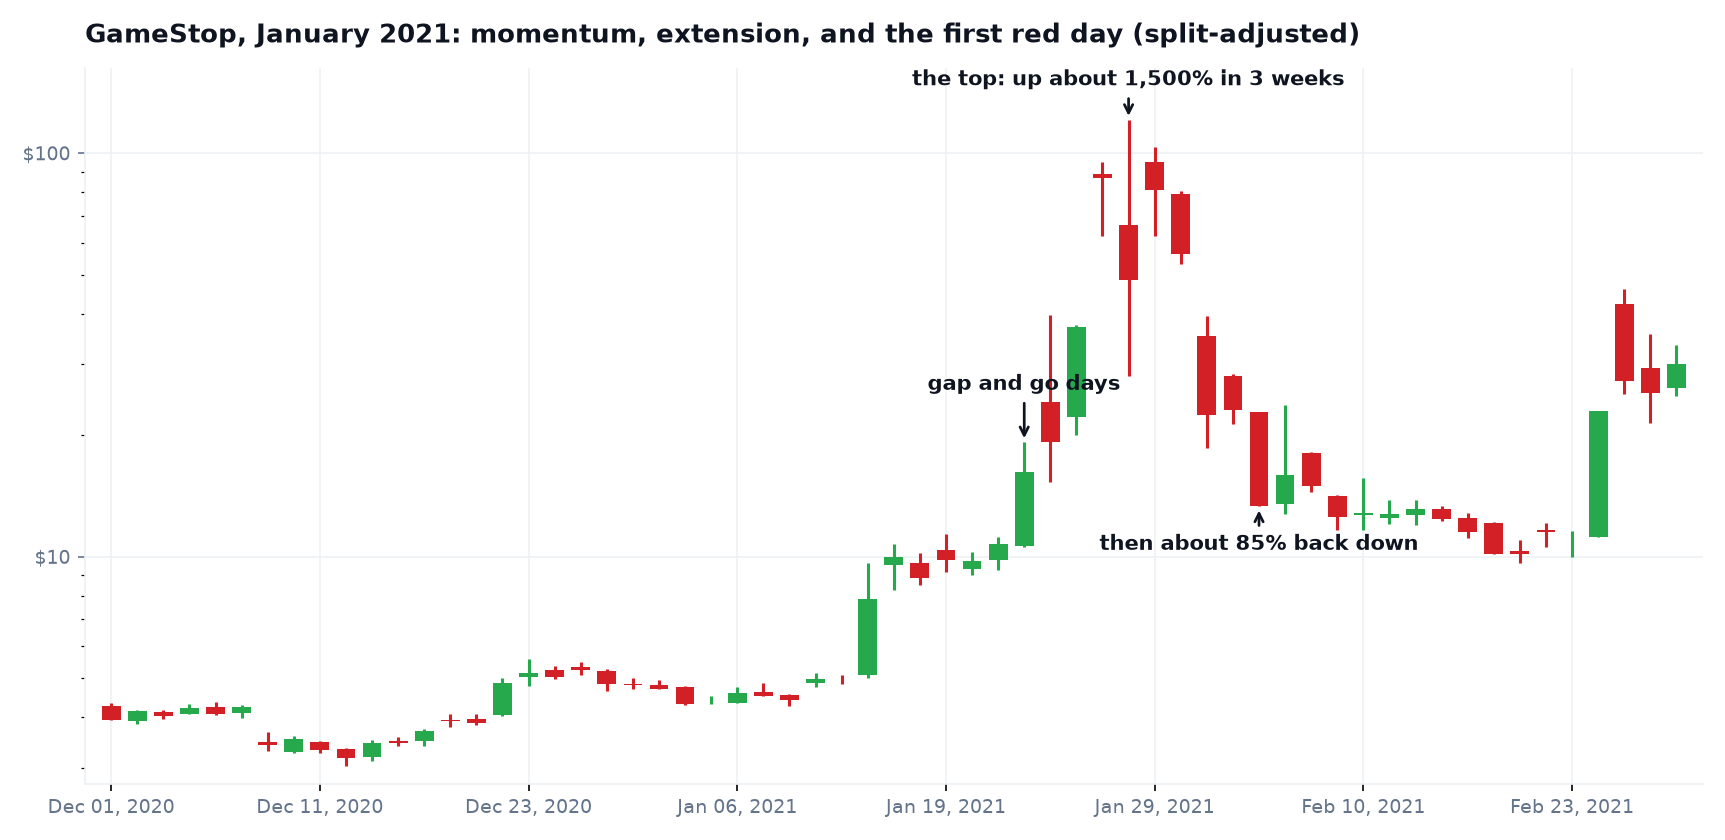
The most famous momentum stock of the decade did everything on this page inside three weeks, then took most of it back. Gap and go days during the run, a parabolic extension into the top, and a first red day that marked the end. The chart uses a log scale because the move is too big for a normal one. Whenever a pattern page makes momentum feel safe, this chart is the correction.
Watch the levels with CryptoAlertly
- Found a flag forming on a coin or stock you track? Set a price alert just above the flag high. The email is your signal to open the chart and judge the breakout volume yourself.
- Set a second alert under the flag low. If that one fires first, the setup is dead and you saved the entry.
- The smart alert entry with take-profit and stop-loss tracks both exits for you once you are in a position.
Turn this into real alerts
Free plan, no card needed. Set a price target and we email you when it is crossed.