Candlesticks explained
What one candle tells you: open, high, low, close, and what the colors mean.
What one candle actually is
Every trading chart you have ever seen is built from the same little shapes. One candle summarises everything the price did during one period of time, using just four numbers, called OHLC: where the price Opened, the Highest it reached, the Lowest it touched, and where it Closed when the period ended.
Worked example. A daily Bitcoin candle showing O $60,000 · H $63,200 · L $59,400 · C $62,500 means: the day started at $60,000, at some point buyers pushed it to $63,200, at some point sellers dragged it down to $59,400, and the day ended at $62,500. Because the close is above the open, the candle is green, and because both wicks are visible, you know the day was a fight in both directions before buyers won.
What the colors mean
Green (white on some platforms): the price closed higher than it opened. Buyers won that period.
Red (black on some platforms): the price closed lower than it opened. Sellers won that period.
Color alone says nothing about "good" or "bad". A single red candle inside a strong uptrend is normal breathing. What matters is the size of the body, the length of the wicks, and where the candle appears, which is exactly what the next topic covers.
Example. Ten green candles in a row with growing bodies show accelerating buying. One tiny red candle after them means almost nothing. A huge red candle that swallows the previous three green ones is a genuine warning sign.
Timeframes: one candle equals one period
The same market can be drawn with candles of any duration. On a 1-minute chart each candle summarises one minute. On a daily chart it covers one day, and on a weekly chart a full week. Nothing else changes, the OHLC logic is identical.
Short timeframes show detail but mostly noise. Long timeframes show the real trend but react slowly. That is why day traders live on minutes and hours while long-term investors rarely look below the daily chart.
Example. A week where Bitcoin fell hard on Monday and recovered by Friday looks like five dramatic daily candles, but on the weekly chart it is a single calm candle with a long lower wick, the classic sign that buyers stepped in. Same events, different depth of story.
The same candles on a real chart
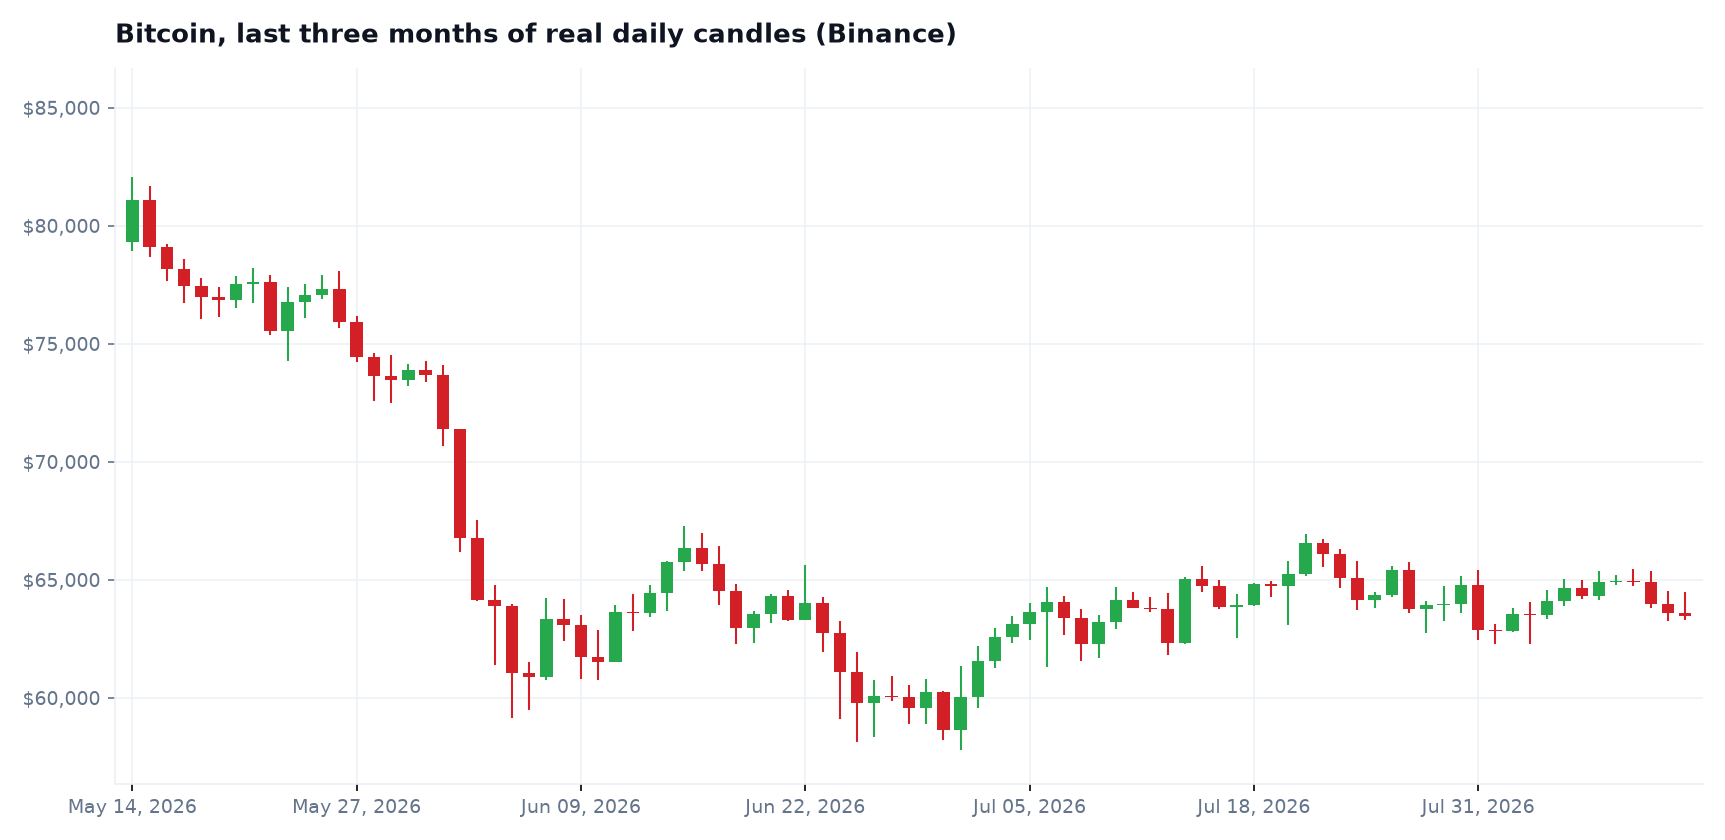
Everything above was drawn to be clean. This is what candles look like in the wild: three months of real Bitcoin daily data. Notice how green and red days cluster into runs, how the wicks mark prices the market tried and rejected, and how a single candle only makes sense next to its neighbours.
Turn this into real alerts
Free plan, no card needed. Set a price target and we email you when it is crossed.