مراقبة الاختراق
اقتنص اللحظة التي يتجاوز فيها السعر مستوى يراقبه الجميع.
ما هي
يحدث الاختراق عندما يتجاوز السعر مستوى فشل في تجاوزه عدة مرات من قبل (المقاومة)، أو يهبط تحت مستوى كان يسنده (الدعم). يقرأ المتداولون الاختراق النظيف كبداية محتملة لاتجاه جديد. وإن كانت هذه المصطلحات جديدة عليك، فاقرأ أولًا موضوع الدعم والمقاومة والاختراق.
لماذا يستخدمها الناس
إنها من أقدم الملاحظات في التداول: عندما يتجاوز السعر أخيرًا مستوى يراقبه الجميع، كثيرًا ما تتفعّل أوامر الإيقاف ويدخل مشترون جدد فتتسارع الحركة. ومعرفة اللحظة التي يحدث فيها ذلك أهم هنا من أي استراتيجية أخرى، ولهذا يعشق متداولو الاختراقات التنبيهات.
مثال عملي. فشل البيتكوين عند 65,000 دولار ثلاث مرات في شهرين. تضبط تنبيهًا عند 65,500 (فوق المستوى قليلًا لتتجاوز الوخزات الكاذبة). بعد أسابيع يصلك البريد: البيتكوين يتداول عند 65,600 بحجم قوي. الآن تنظر إلى الرسم وتقرر، بعد دقائق من بداية الحركة لا بعد ساعات.
ما الذي يجب الانتباه له
- الاختراقات الكاذبة شائعة: يلامس السعر ما فوق المستوى فيُفعّل تنبيهات الجميع ثم يرتد. كثير من المتداولين ينتظرون صمود السعر فوق المستوى بضع ساعات، أو إعادة اختباره من الأعلى، قبل التصرف.
- الاختراقات ذات الحجم المنخفض تفشل أكثر من التي يقف خلفها جمهور.
- ملاحقة اختراق متأخرًا بنسبة 5% تدمّر الاحتمالات. إن فاتك انتظر إعادة الاختبار أو اتركه. هناك دائمًا مستوى آخر.
اختراق راقبه السوق كله
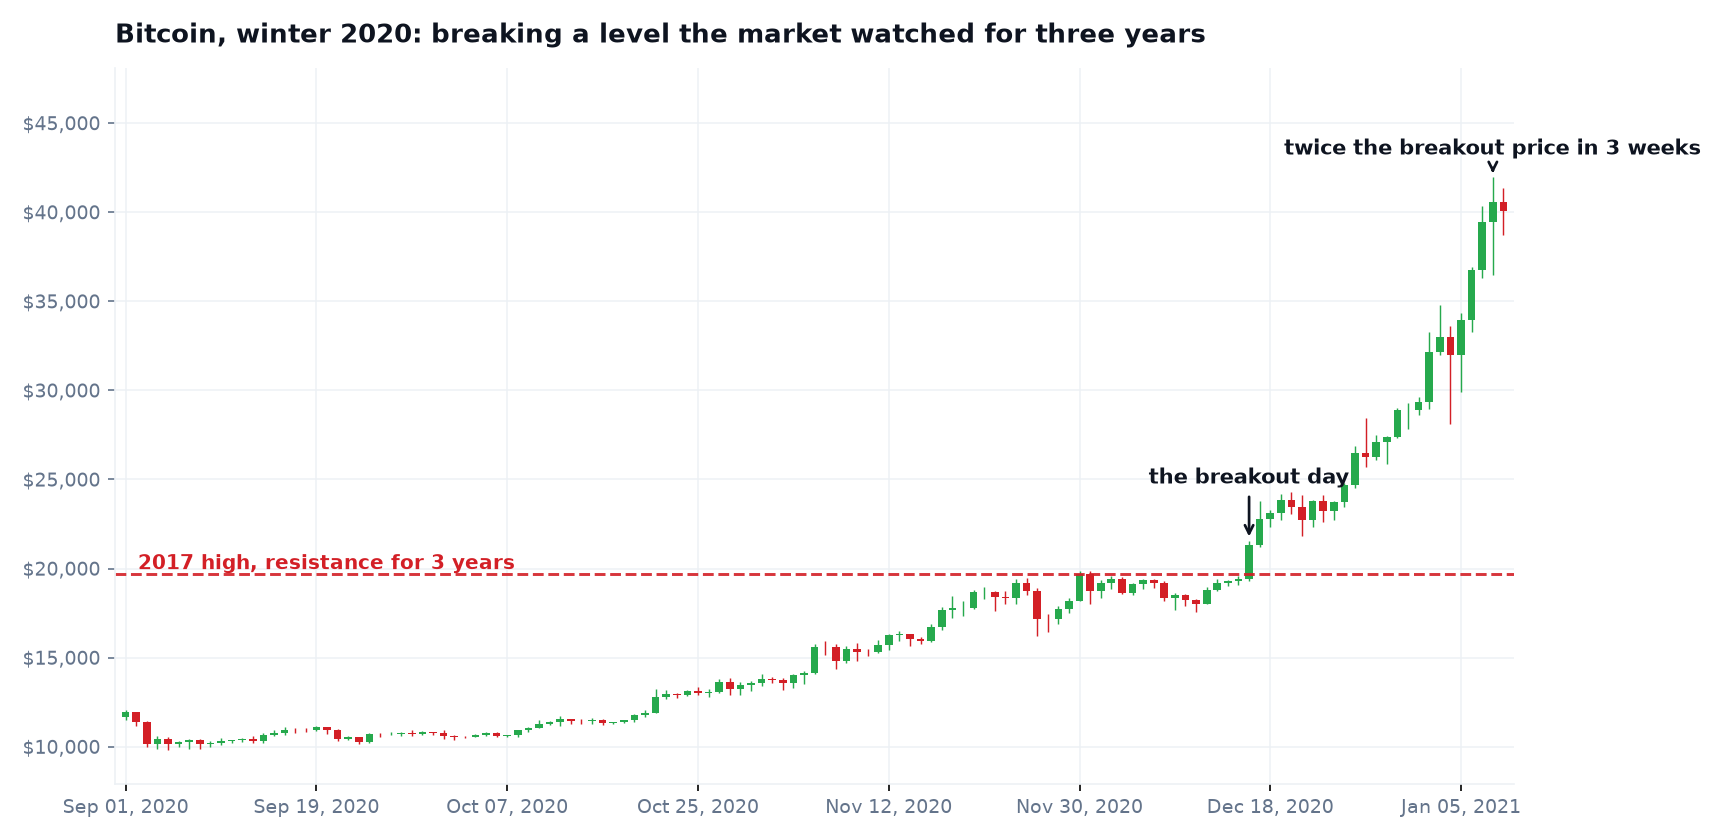
قمة 2017 قرب 19,700 دولار صدّت بيتكوين ثلاث سنوات. وطوال أواخر 2020 ظل السعر يضغط عليها أسابيع. في 16 ديسمبر انكسرت أخيرًا، وتحول المستوى الذي يراقبه الجميع إلى نقطة انطلاق: تضاعف السعر في ثلاثة أسابيع. لم يكن على متداولي الاختراق أن يتنبؤوا بشيء، فقط أن يصلهم إشعار لحظة انكسار الخط.
نفّذها مع CryptoAlertly
- جد المستوى: انظر إلى رسم الأصل ولاحظ أين توقفت الارتفاعات الأخيرة مرارًا، مثلًا $65,000 للبيتكوين.
- اضبط تنبيهًا عندما يتجاوز السعر ذلك المستوى، ويفضّل فوقه بقليل. الاختصار اختراق +10% يستخدم 10% فوق السعر الحالي إن لم يكن لديك مستوى محدد.
- عندما يُطلق لا تلاحق فورًا. تحقق من الحجم ومن صمود المستوى ثم قرر.
- شاهدها تتكرر بأمان في المحاكي: اختر «الاختراق» ولاحظ كم مرة لا يصل السعر إلى خط الهدف أصلًا، وهذا لا يكلفك شيئًا.
حوّل هذا إلى تنبيهات حقيقية
خطة مجانية بلا بطاقة. حدد سعرًا مستهدفًا ونرسل لك بريدًا عند تجاوزه.