Support, resistance, breakouts
How to find the levels that matter and turn them into alerts.
From single candles to the whole picture
Single candles are letters. The chart is the sentence. The two most useful lines you can draw on any chart are support (a floor where falls keep stopping) and resistance (a ceiling where rallies keep failing). A breakout is the moment price finally pushes through one of them.
Support: the floor
Support is a price level where buyers have repeatedly shown up. Each time the price falls there, it stops and bounces. The more times it holds, the more traders watch it, which is partly why it keeps working.
Example. A coin drops to $1.80 in March, again in May, and again in July, and bounces every time. $1.80 is support. If you have been waiting to buy, that is a level worth an alert.
Resistance: the ceiling
Resistance is the mirror image: a level where sellers keep appearing and rallies keep dying. Often it is a round number, a previous all-time high, or the price where a lot of people bought earlier and now want to break even.
Example. Bitcoin approaches $65,000 three times in two months and falls back each time. $65,000 is resistance until the day it is not.
Breakout: the moment it gives way
When price finally closes clearly above resistance (or below support), the level has broken. Traders watch for this because the old ceiling often becomes the new floor, and because a lot of orders trigger at once, which can accelerate the move.
False breaks, and how people handle them
Not every break is real. Price often poking just above resistance, triggering everyone's orders, then collapsing back is common enough to have a name: a fakeout. Two habits reduce the damage: wait for the period to close beyond the level rather than reacting to a spike, and check whether the level holds when price comes back to test it from the other side.
A real year of support and resistance
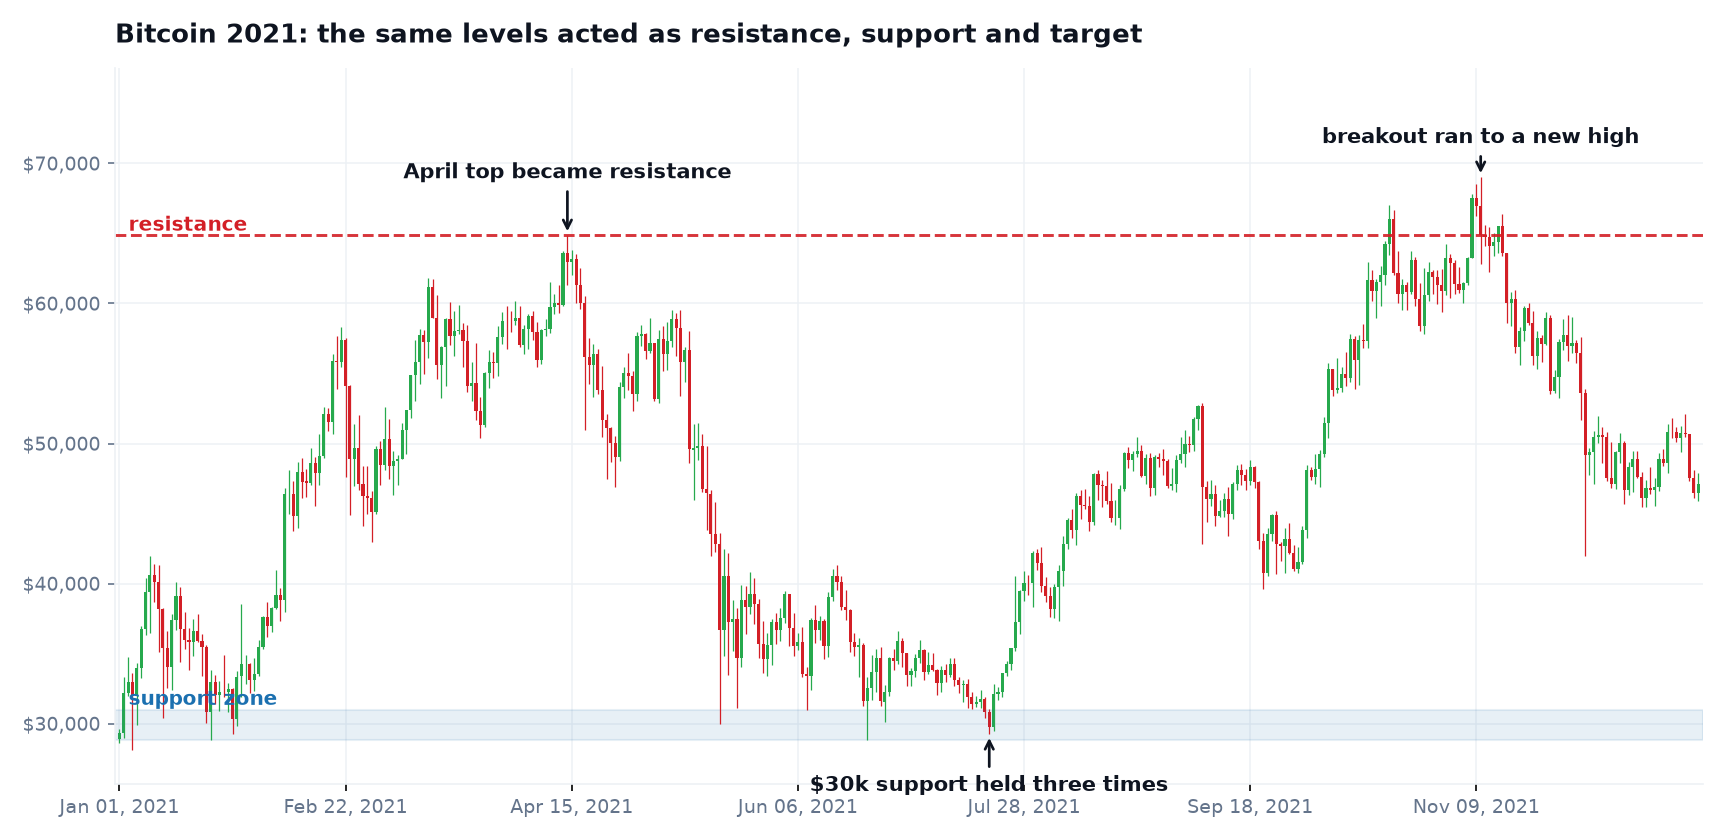
Bitcoin's 2021 is a textbook that actually happened. The April top near $65,000 became resistance for half a year. The $30,000 zone was defended three times across the summer. When price finally cleared the old top in October, the breakout ran to a new all-time high within weeks. The levels were visible long in advance, which is exactly why alerts placed on them worked.
Run it with CryptoAlertly
- Look at the asset's chart and write down the two levels that matter: where it keeps bouncing, and where it keeps failing.
- Set alert ABOVE resistance to catch a breakout, and alert BELOW support to know the floor gave way. Both can be active on the same asset at once.
- When the email arrives, look at the chart before acting. The alert buys you attention at the right moment, it does not make the decision.
Turn this into real alerts
Free plan, no card needed. Set a price target and we email you when it is crossed.